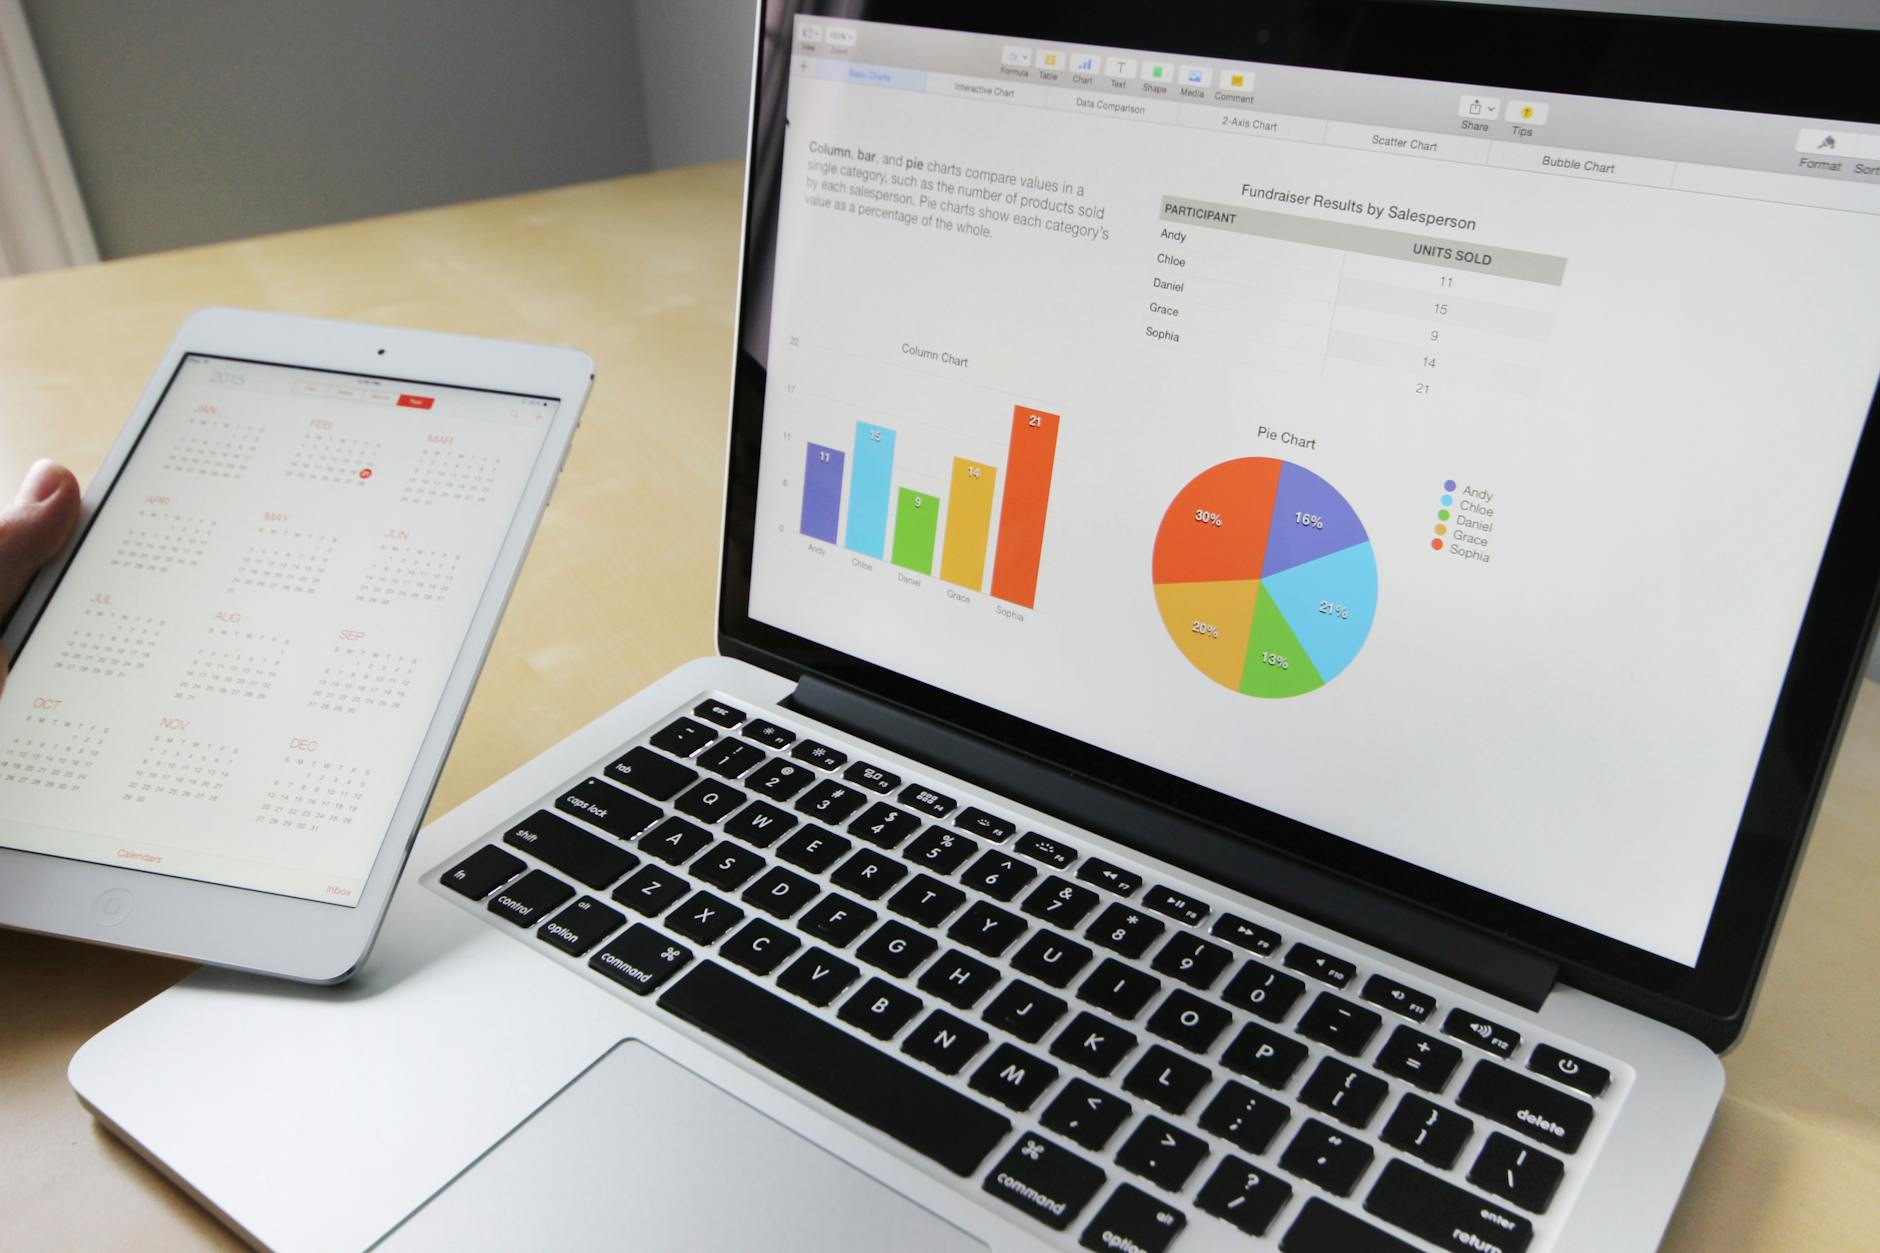
Power BI Solutions for Distributors.
Helping distribution companies reduce stockouts, forecast demand, and grow profit with custom Power BI dashboards.

Advanced Data Visualization Services
Data Modeling and Transformation
Integrate and cleanse data from multiple sources, ensuring it's accurate and ready for analysis using Power Query.

Power BI Dashboard Development
Create custom, interactive dashboards tailored to track key business metrics like sales and inventory. Optimize for desktop and mobile access.

Advanced Analytics & Reporting
Design custom reports and leverage complex DAX formulas to create dynamic, data-driven insights. Track key metrics and build advanced calculations to meet specific business needs.

Example Dashboard
Dashboard created for a distribution company to compare sales and shipping volumes YoY across weekly, monthly, and quarterly timeframes. Users can toggle between units, revenue, and profit with a single click.

Why Power BI?
Power BI connects directly to your inventory, ERP, and sales systems — no manual updates or spreadsheets. It delivers real-time dashboards your team can explore anywhere, helping you monitor stock levels, track sales, and forecast demand.
Unlike Excel, Power BI handles large datasets with ease and offers deeper insights, interactive visuals, and role-based access — all with less manual effort.